

Data Projects
SQL, transformation, and dashboard projects framed around audit-style review.
Data projects demonstrating structured analysis, transformation, modeling, and reporting through examples that support trend review, segmentation, outlier identification, and business risk analysis.
Demo note: This project is for demonstration and discussion purposes only. It uses generalized, synthetic, or public data. No proprietary company data, confidential audit documentation, internal systems, or client information are included.
Analytical approach
The same data skills used in audit analytics apply across business datasets.
These projects are not formal audit datasets, but they demonstrate core techniques used in audit analytics: population review, segmentation, ranking, trend analysis, transformation, dashboard development, and supportable interpretation.
Structure the data
Clean, transform, and model raw data so it can support reliable analysis and reporting.
Analyze patterns
Use SQL and BI tools to identify trends, rankings, segments, variances, and potential outliers.
Communicate findings
Translate analytical results into visuals and summaries that support management review and decision-making.
SQL analysis example
Data Job Market Analysis
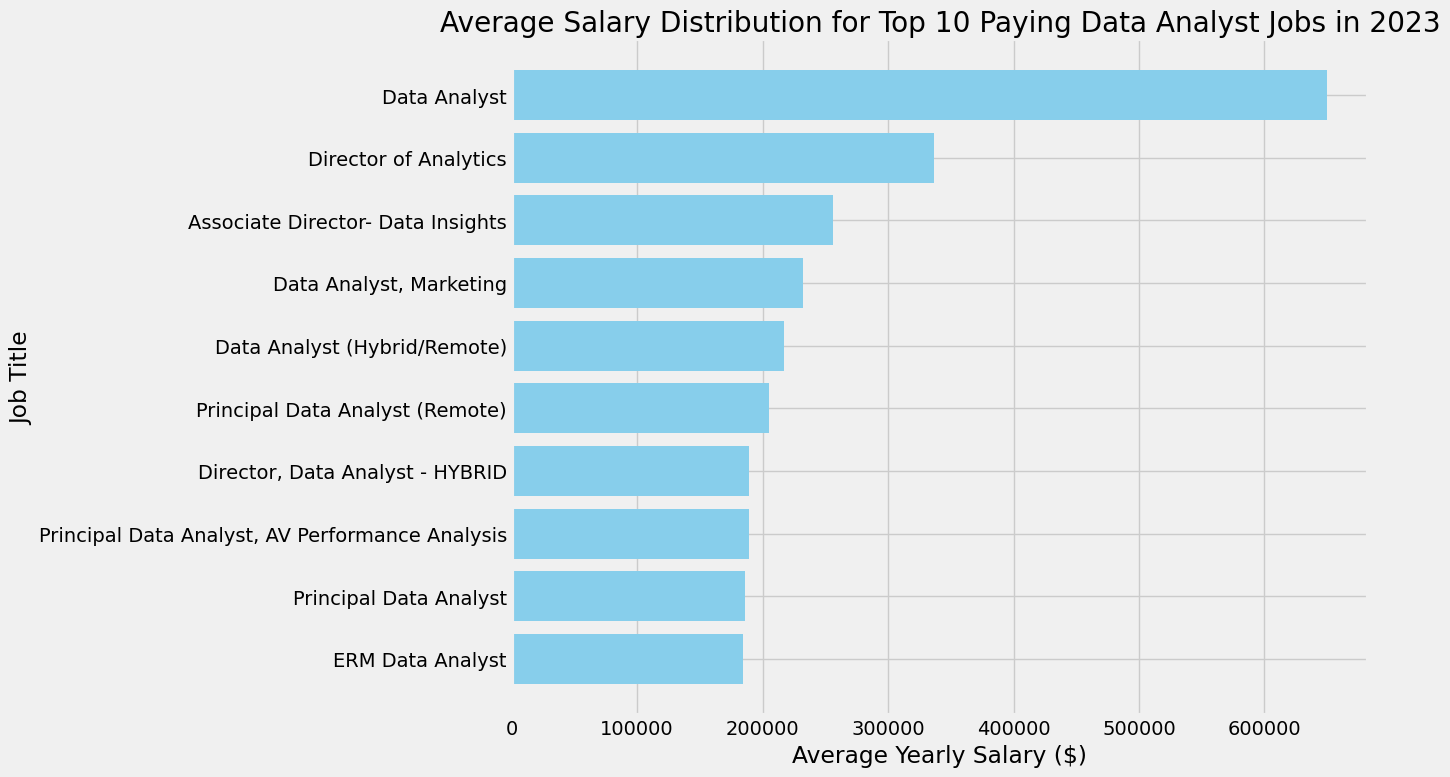
Structured SQL analysis of a large external job posting dataset, including segmentation, ranking, trend identification, and evidence-based interpretation.
Demonstrate structured SQL analysis of a large dataset using repeatable queries, ranking, segmentation, and interpretation.
Understanding which data skills are in highest demand and command higher compensation requires analyzing job postings across roles, skills, locations, and salary ranges.
Queried job posting data using SQL to identify trends in required skills, job titles, compensation ranges, and market demand patterns.
Demonstrates analysis techniques used in audit analytics: population review, segmentation, ranking, outlier identification, trend analysis, and supportable conclusions.
Example output from SQL analysis of data job market compensation and role trends.
Transactional data example
Sales ETL & Performance Dashboard
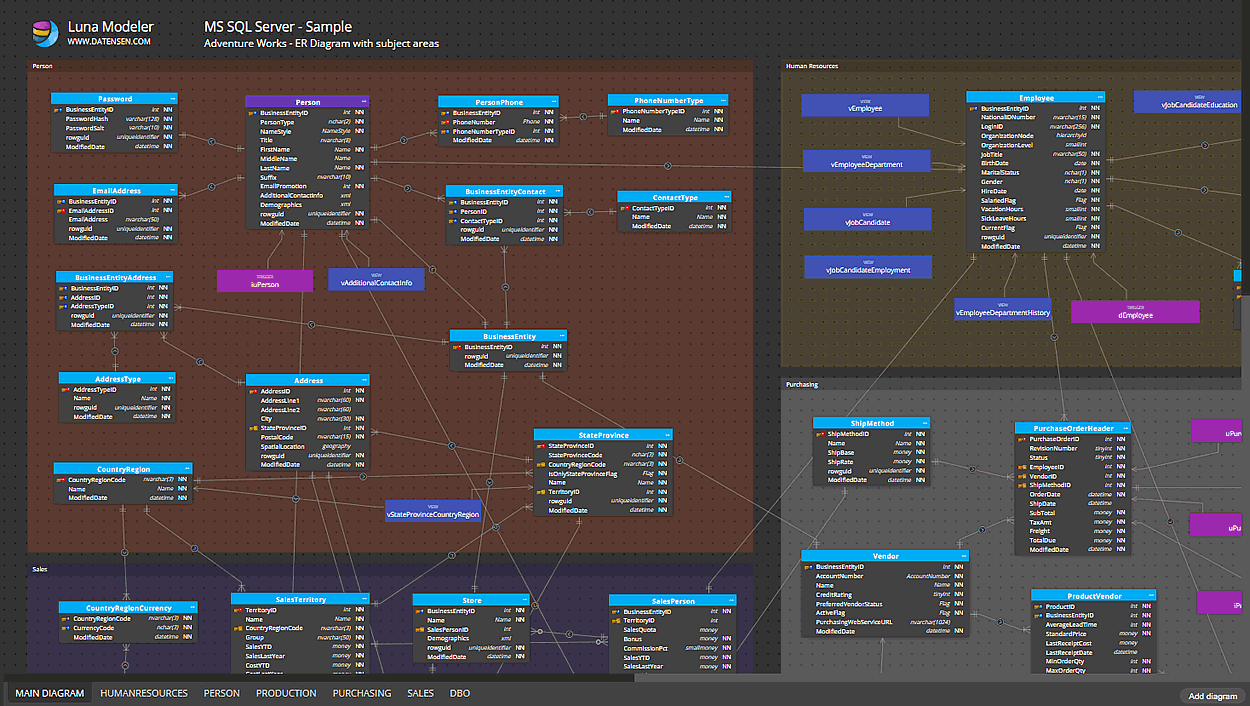
End-to-end project showing how raw transactional data can be cleaned, transformed, modeled, and visualized to support performance review and business risk analysis.
Demonstrate how raw transactional data can be transformed into structured reporting that supports performance review and risk analysis.
Raw sales data often requires significant transformation before it can support meaningful analysis of revenue trends, profitability, product performance, customer behavior, and operational drivers.
Designed an end-to-end pipeline using SQL to clean, transform, and model sales data, followed by a Power BI dashboard for reporting and analysis.
Supports trend analysis, variance review, margin analysis, outlier identification, and targeted follow-up.
Sales performance dashboard showing transformed transactional data in a management reporting format.
Skills demonstrated
Technical execution with an audit and business-risk mindset.
Querying and analysis
Filtering, joining, grouping, ranking, aggregating, and interpreting structured datasets.
Data transformation
Cleaning and reshaping raw transactional data into a usable analytical model.
Dashboard reporting
Building visuals that communicate trends, performance drivers, and areas that may warrant review.
Data projects
Data analysis becomes more valuable when it supports review, risk identification, and action.
Explore audit analytics, audit tools, or connect with me on LinkedIn.